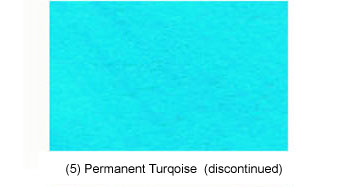
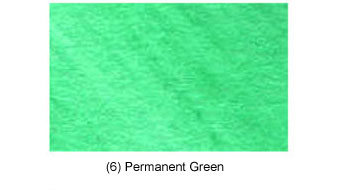
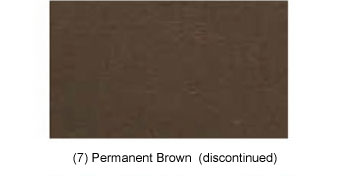
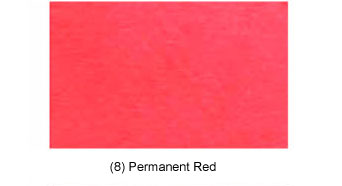
Quink Ink Charts Part I
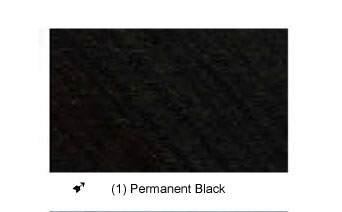
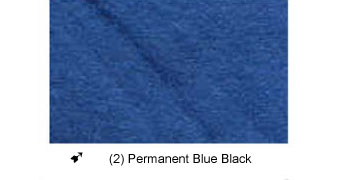
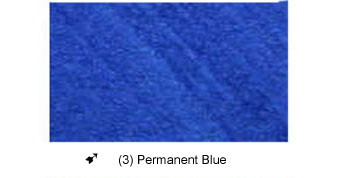
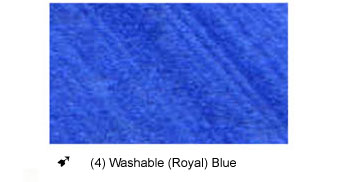
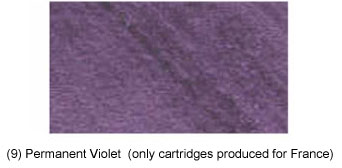
This is the first in a series of ink charts, produced by Michael Richter. The images were scanned in at a resolution of 300dpi and have been reproduced here as faithfully as possible to the original. The chart has been broken into several separate images to facilitate downloading, please be patient, images of this size take time to load.
The first page (this page) shows solid color rectangles, the next page shows lines (squiggles) laid down with a nib.
It is very difficult to reproduce accurate colors on the web; unless you have calibrated your monitor you will only see a representation of the actual color. Even properly produced ink samplers such as that by Greg Clark will only give an idea of the actual color of ink, nib size, flex, ink flow and drying conditions all introduce variables. So with all this in mind..enjoy!